Do you have big data chops?
Quick, what do these three things have in common?
- Yankees, Giants, Rangers, Knicks
What about these?
- Beatles, Monkees, Beach Boys
Do you have an answer for each? "New York," for example, for the first list and "Rock and Roll" for the second? If so, call yourself a "data scientist!"
The Computer Groups Users
The Big Data Personality Test follows a similar process. I feed 1 billion test results into a computer program that "learns" the data. The program looks for patterns and finds that, for exmple, people who answer "yes" to "question 1" also answer yes to questions 8, 9 and 31 and "no" to question 15. The program then separates test takers based on their answer patterns.
Now answer the following question. You may find the question a little tricky so I drew a picture to help you "cheat." Think of a row on a "Tic Tac Toe" board. You have three spaces and can place either an "X" or "O" on each space. How many unique rows (patterns) can you make from this?
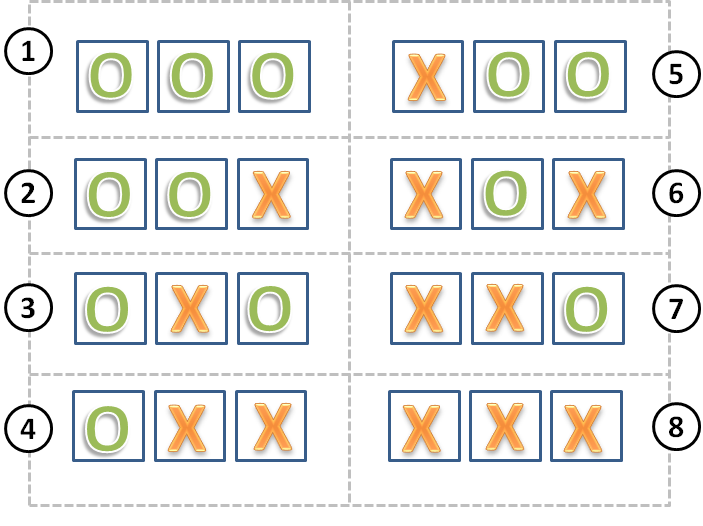
As you can see from the picture, each row in a game of Tic Tac Toe can only have one of eight possible patterns. Three spaces in a row, with an "X" or "O" on each space gives us eight unique patterns. You will see this phenomenon in the next section, where I reduce each test taker to a "row" with three "factors" (i.e.Tic Tac Toe spaces) that can be "on" or "off" (i.e. an "X" or "O").
I feed the 1 billion test responses into another computer program that reduces the "answer patterns" into three types (or "factors"). From this program I reduced the possible number of unique test "answer paterns" from 1,130,000,000,000,000 to eight.
A Fun Game
Are you still with me or are you bored? Here is a fun game. The "big data" program only identifies the patterns, I must name them.
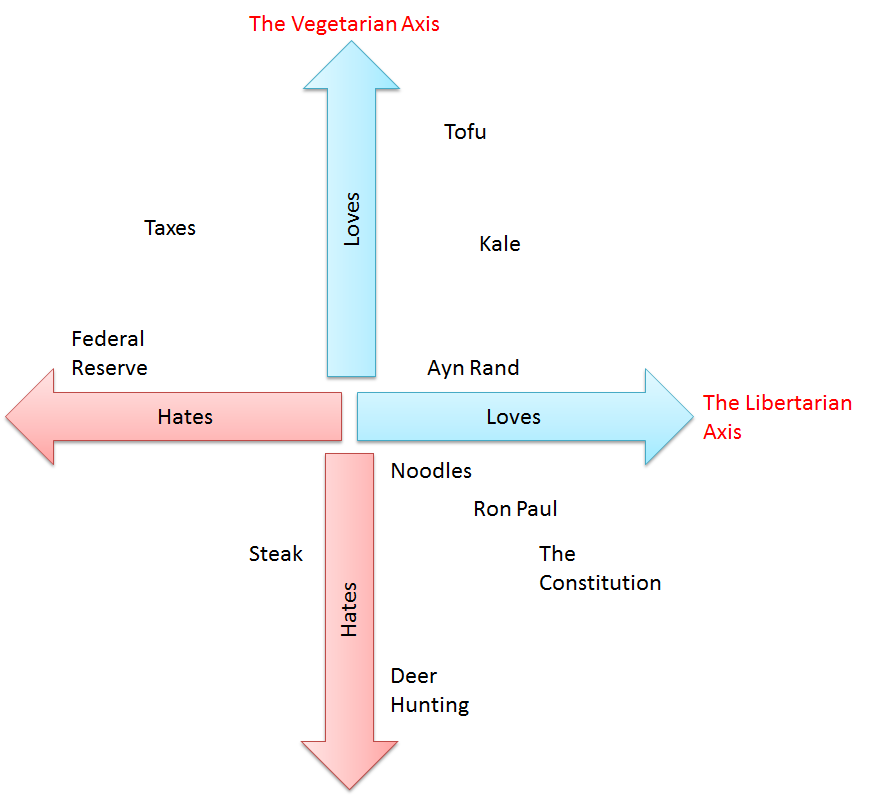
What would you name this spectrum?
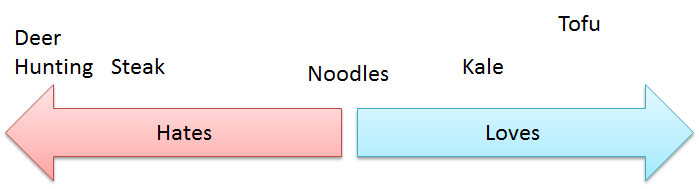
How about "The Vegetarian Spectrum"
What about this one?
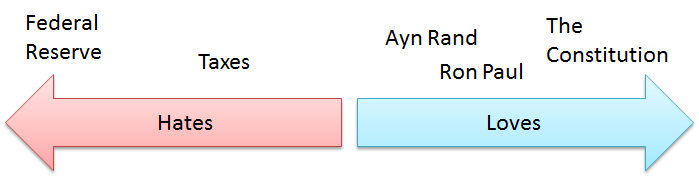
I'd name it "The Libertarian Spectrum"
And finally, we have this one:
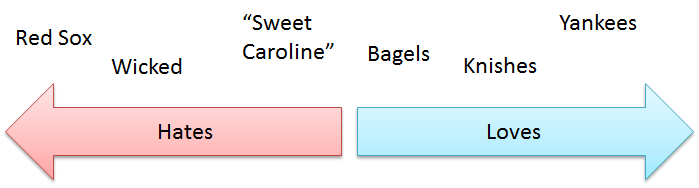
I'd name it "New Yorker Spectrum"
We call these three spectrum independent. If you're from New York, you might be a libertarian or a vegetarian, but one does not cause the other. (In reality, you might find correlation but bear with me here. If you want specifics, then read my blog post about the Math).
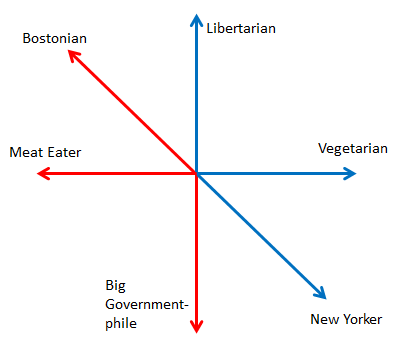
We can combine two of these spectrum. Let's combine, for example, the "Vegetarian" and "Libertarian" spectrum. Then we have four types of people: "Libertarian Vegetarians," "Libertarian Meat Eaters," "Big Government Vegetarians" and "Big Government Meat Eaters." Take a look at the chart below.
We can still have a pretty picture in three dimensions if we overlay the third spectrum on the graph:
Name the Groups
Enough of the example spectrum, let's look at the real data. I obtained the data from actual test takers on Facebook. When I crunch the numbers on the test takers, machine learning outputs three groups, or factors:
Factor #1: Drug and alcohol users that have been naked in public, distrust cops and do not believe strongly in God.
Factor #2: Leaders that champion others, would martyr themselves for an idea and believe they can learn from all setbacks.
Factor #3: Strongly believe men and women should be attractive, judge people on their fashion and think in concrete, all or nothing terms.
What would you name these factors?
Plot the Data
I named #1 "Hellraisers", #2 "Boy Scouts" and #3 "Celebrities."
I graphed the factors against each other.
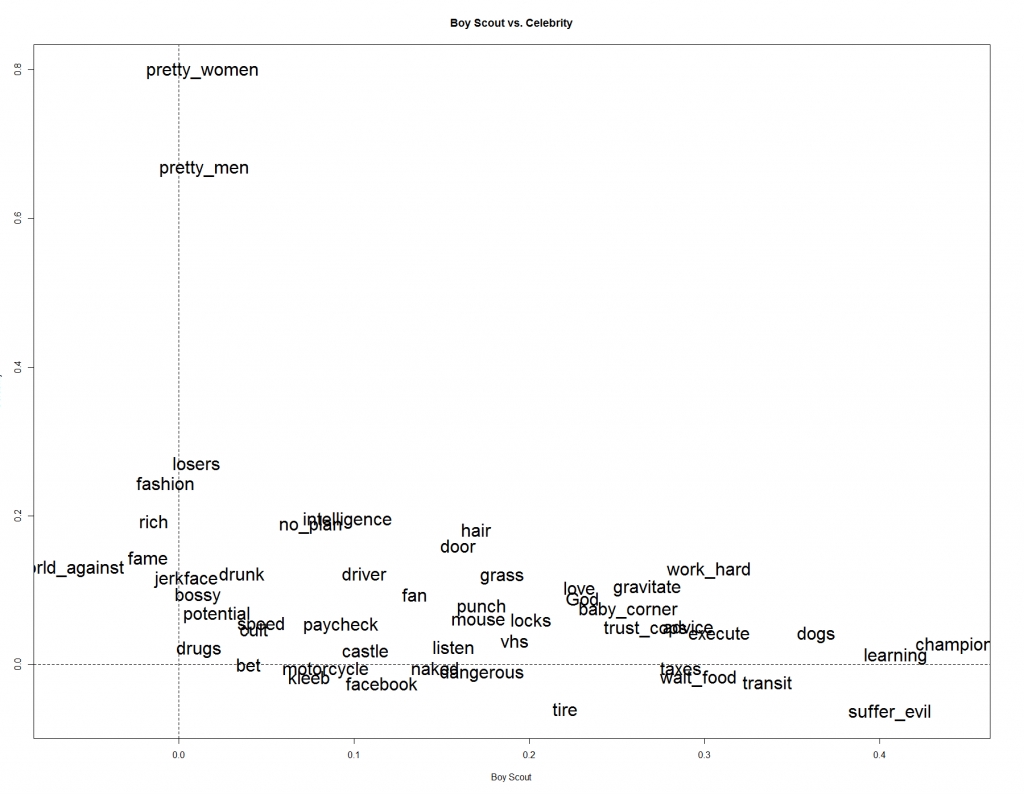
Take a look at Hellraiser vs. Boy Scout. If this graph confuses you, take a look at some of New York magazines' Approval Matricies. You will quickly get an idea of how the matricies work.
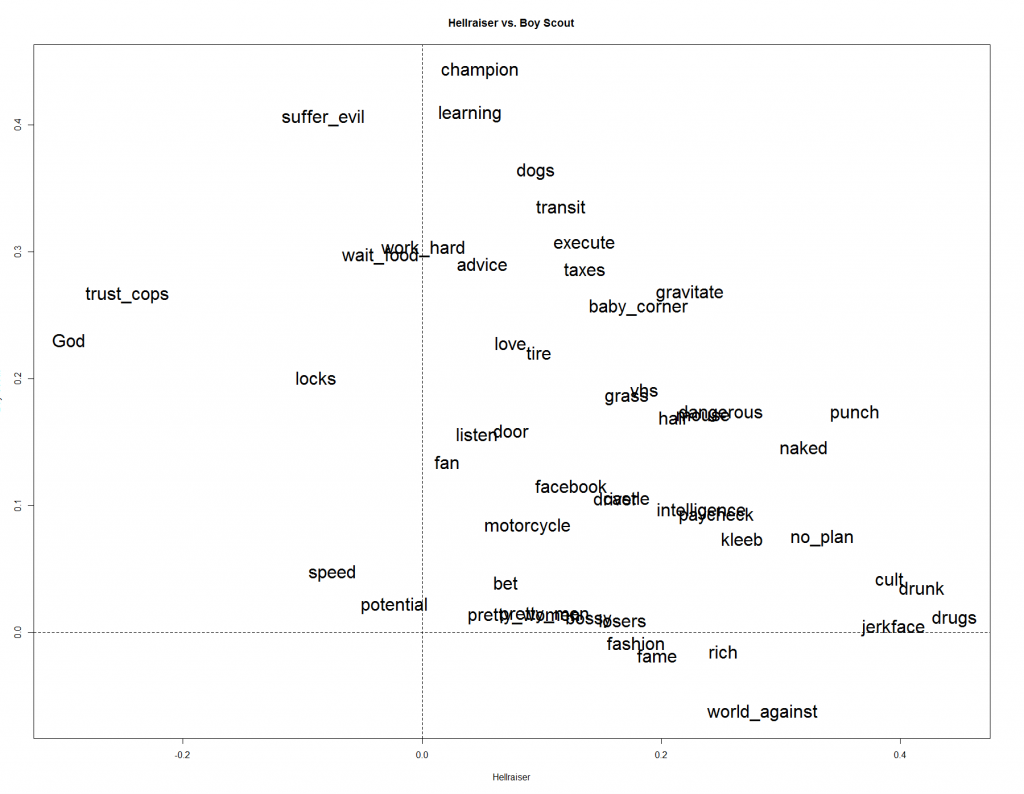
Look at the "left/ right" axis above. You can see, all the way to the right, that positive attitudes towards drinking and drugs defines a test taker as a "hellraiser" and negative attitudes (all the way to the left) about trusting cops and belief in God also define them as a "hellraiser." On the "up/ down" axis (Boy Scout), championing others and learning from failures define the Boy Scout. Notice how "Champion," high up on the "Up/ Down" axis, falls right near the middle of the "Left/ Right" axis. So attitudes about "Championing others" weights the "Boy Scout" judgement but doesn't do much for the "Hellraiser" judgement. Likewise, "drugs" greatly defines the "Hellraiser," but doesn't weigh either way for the "Boy Scout" factor (look at how close it lies to the horizontal dotted line.)
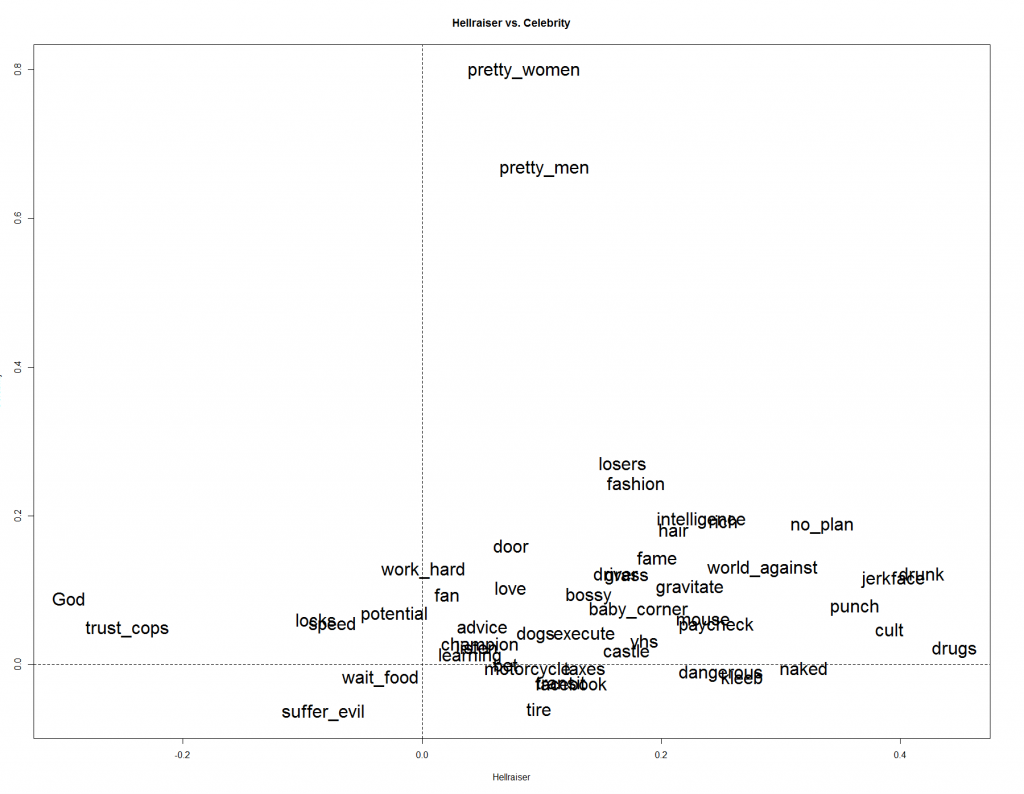
On the "Hellraiser" vs. "Celebrity" scale, most of the "Hellraiser" qualities do not provide much weight to the "Celebrity" judgement. You can see that most of the Hellraiser factors lie close to the zero point (i.e. the dotted horizontal line) for the "Celebrity" spectrum. Pretty Men, and Pretty Women, however, hugely weigh in on the celebrity scale.
We witness the same distribution on "Boy Scout" vs. "Celebrity." Most "Boy Scout" traits do not weigh heavily on the "Celebrity" decision and vice versa. You can see this by simply noticing the words closely align with the x and y access.
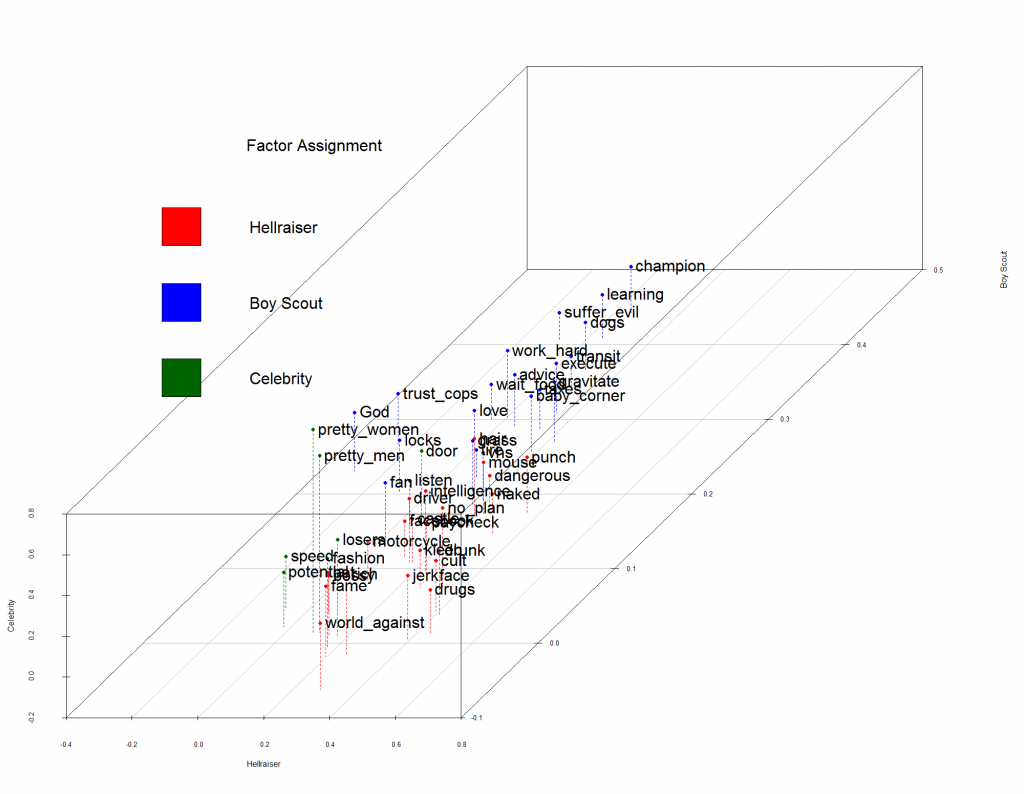
If you're interested, you can see the three factors plotted on a three dimensional graph. Again, the graph below shows the actual placement on the graph, based on the real-life test takers.
Get the Results
When you take the test, the machine learning looks at your answers and matches them to the patterns for each of the factors. It places you on the spectrum for each factor and based on the placement it classifies you as one of the eight categories. For a given user, the factor switches on depending on how you compare to the rest of the test-takers. So, as more people take the test, the factors, weights, placement and classifications change.
If you made it this far, you now have a solid understanding of Exploratory Factor Analysis (EFA). If you want more detail, then check out the math.